

Welcome to
LifeMap Discovery

Watch the introductory video to learn more about our database of embryonic development for stem cell research and regenerative medicine
Gene Expression
LifeMap Discovery® as a Novel Gene Expression Database
LifeMap Discovery, which functions as a gene expression database, aims to sketch a systematic map of gene expression profiles within normal and diseased tissues and cells.
- Gene expression profiling is presented for developing and adult mammalian organs, tissues, anatomical compartments and cells, as well as for cultured stem, progenitor and primary cells, or cells derived via differentiation protocols. This allows for characterization of cells by their gene expression patterns.
- Currently, gene expression profiles of 82 diseases are available. This data are separated from the normal gene expression profiles of these tissues and are also presented in the disease card in MalaCards.
- Gene expression profiles include annotations relating to developmental path-specific and enriched genes, selective gene markers in cells, and other genes whose expression has been reported in the scientific literature, high throughput experiments and public large scale datasets.
- Differential gene expression from high throughput experiments is calculated using an algorithm developed by LifeMap Sciences, allowing standardization of gene expression lists.
- Gene expression data extracted from public large scale in situ hybridization and immunostaining databases are linked to the organs/tissues/compartments/cells (entities) in LifeMap Discovery and to the corresponding image.
Gene Expression During Development and in Stem Cell Research
During very early development, cells are totipotent, with the potential to develop into any type of mature cell in the developing embryo. As development proceeds, the cells lose this potential and their final fate is determined. Throughout this differentiation process, cells go through a number of stages, each characterized by unique gene expression profiles. The final cell type is determined via the integration of the expression or repression of specific sets of genes, as well as by regulation at the epigenetic and protein levels.
Stem cells demonstrate two unique characteristics distinguishing them from other cells in the body.
One is their potential to differentiate into different cell types during early development and in the
adult body, while the second is their self-renewing capacity, which makes them a potential cell reservoir
for tissue repair. While most of the stem cells become differentiated, mammalians retain some stem/progenitor
cells during adult life. These cells, under specific conditions, can develop into specialized cells
and function as replacements for cells that are lost through normal physiological processes, injury
or disease.
These stem and progenitor cells can be cultured in vitro and induced to differentiate into specific
cell types. Their stemness and differentiation pathways are determined by the sets of genes being expressed,
which, in the case of cultured cells, is dependent on the specific treatment the cells receive and their
culture conditions.
Gene Expression Modeling in LifeMap Discovery
LifeMap Discovery provides a snapshot of gene expression patterns at cellular and anatomical resolutions. The LifeMap database includes the following entity types: in vivo cells, anatomical compartments, tissues, organs and cultured cells, including protocol-derived cells (PDCs, cells derived during a differentiation protocol). Gene expression data are accrued by manually surveying the published literature and/or by extracting information about the gene status from related high throughput experiments (see below – High throughput gene expression in LifeMap Discovery). The information is then allocated to appropriate entity cards. Hence, the database can be used as a platform for identifying cells, based on specific gene expression profiles.
Background information
High Throughput Gene Expression
DNA microarray
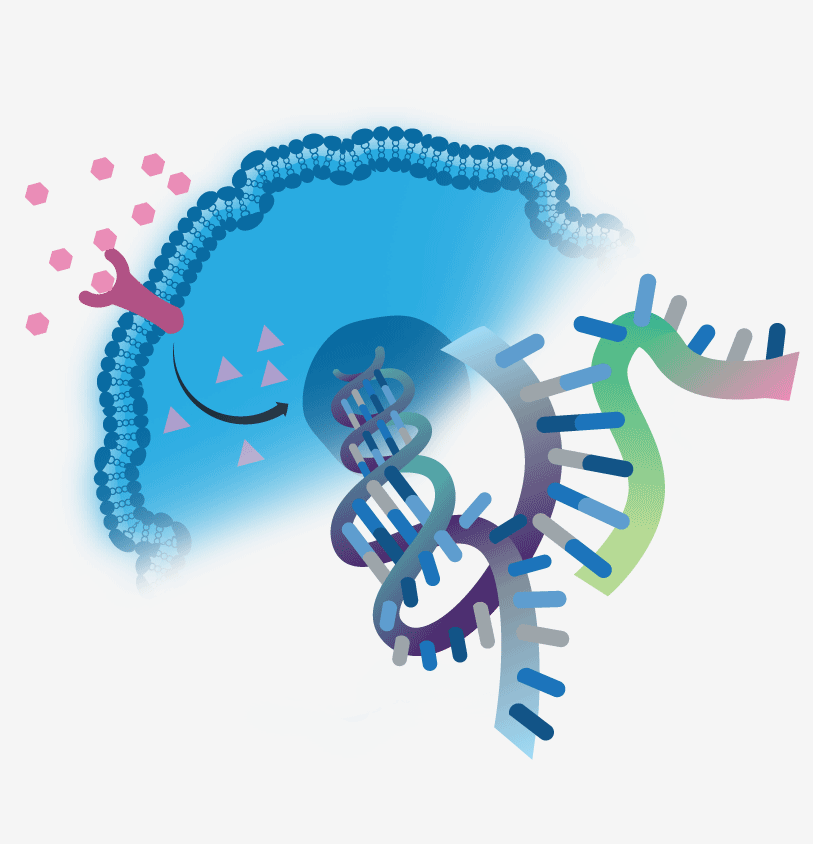
A DNA microarray is a collection of thousands of microscopic DNA spots attached to a solid surface. The number of genes attached depends on the array design, but generally covers all the expressed genes in the genome. RNA is extracted from cells of two populations under investigation, and reverse transcribed to cDNA. The cDNA is fluorescently labeled and applied to the microarray chip. After hybridization of the labeled cDNA to the probe, the microarray is scanned. The fluorescence intensities of the spots, which correspond to the level of gene expression in each population, are normalized and compared. The comparison is usually performed by calculating the normalized intensity fold change of one sample versus the other, with additional statistical analysis to exclude false-positive results.

|
A DNA microarray experiment compares gene expression between two populations. The DNA microarray chip contains a collection of thousands of microscopic DNA spots, termed probes, attached to a solid surface. Common microarrays contain probes corresponding to 20,000-40,000 genes. Other types of arrays include the exon arrays and the miRNA arrays which contain probes unique to all exons in the genome or to miRNAs respectively. In the microarray technique, RNA is isolated from cells or tissues (A) and reverse transcribed to cDNA (B). At this stage, the cDNA is labeled and then hybridized to a microarray (C). The more copies a specific transcript has in the RNA sample, the stronger the staining intensity will be. The microarray is then scanned to quantify the staining intensity in each spot, which enables calculation of the relative gene expression. (D). In current illustration, the gene marked pink has a higher expression in sample A, the gene marked green in sample B and there is equal expression of the yellow-marked gene in both samples. |
RNA Sequencing
RNA sequencing (RNA-Seq) allows for quantitative determination of RNA expression levels. The method features an advantage over microarrays in that it provides coverage of the entire genome, including the various single-nucleotide polymorphisms (SNPs). In this method, RNA is extracted from cells, and the mRNA is isolated. In some cases, the mRNA is fragmented at this stage. The mRNA is then reverse transcribed into cDNA and then, if necessary, fragmented to lengths compatible with the sequencing system. Once all the fragments are sequenced, the transcripts (or reads) are assembled into genes. Although it is possible to assemble the transcriptome de novo, it is usually more efficient to align the reads to a reference genome or reference transcripts. As RNA-Seq is quantitative, a direct comparison between experiments can be made.

|
To perform RNA sequencing, RNA is extracted from cells or tissues and reverse transcribed to cDNA (A). The cDNA is then digested into fragments, while the fragment length may vary depending on sequencing machine specifications (B). Each cDNA fragment is sequenced in a high-throughput manner to obtain short sequences termed “short sequenced reads” (SSRs). SSRs are aligned to a reference genome to produce a genome-scale transcription map (C). Transcript expression is calculated based on the number of reads aligned to each gene (D). |
In situ hybridization
In situ hybridization (ISH) provides high-resolution gene expression information within the context of their natural location within an organ or organism. ISH uses a labeled cDNA fragment (i.e., probe) to locate a specific DNA segment in a portion or section of a tissue (in situ). The basic steps in ISH include cell permeabilization, hybridization of the labeled probe, and detection of the probe, thereby revealing the location of the mRNA of interest. This process can be adapted to a large scale system and the results are often shown in databases such as MGI, Gensat etc. These databases are linked to LifeMap Discovery.

|
Analysis of gene expression by in situ hybridization (ISH) provides high-resolution information reflecting both gene expression level and location within a tissue or even full organism. ISH can be automated, thereby enabling the determination of gene expression patterns for thousands of genes (large scale ISH). Whole-mount embryos or tissue sections are placed and fixed on a standard microscope slide (A, B). DNA templates are transcribed to cRNA strands, termed riboprobes, which are hydrolyzed, labeled and hybridized to the sections (C). The riboprobes hybridize to their complementary RNA transcripts in the sample, thereby enabling visualization of the RNA transcript location (D). |
High Throughput Gene Expression in LifeMap Discovery
Microarray Data Analysis
Normalized data extracted from microarray analyses and deposited in a public repository, were used to calculate lists of differentially expressed genes, using an eBayseian analysis tool developed at LifeMap Sciences. For normal, non-disease expression data, a Binyamini-Hochenberg False Discovery Rate (FDR) correction for multiple tests is applied (for more information on FDR see FDR in Wikipedia). Genes with p-value < 0.05 and a fold change of at least 2 were regarded as differentially expressed. For experiments that do not have normalized data deposited in a public repository, the differentially expressed gene lists are derived from the article describing the high throughput experiment.
- Click on Examples to navigate
Experiment Card
In the LifeMap Discovery database, high throughput experiments (e.g., DNA microarray and RNA sequencing) are detailed in dedicated experiment cards. In normal gene expression experiment cards, the samples are linked to organ/tissue/anatomical compartment/in vivo cell/cultured cell cards. The genes are allocated to these entity cards based on information from the literature as well as from public gene expression dataset depositories, such as GEO. Each card contains a description of the experiment, a list of the samples tested in the experiment and their related LifeMap Discovery entity cards. Furthermore, a list of the gene expression comparisons between different samples in the experiment is provided. Each experiment includes one or more comparisons, each with its dedicated card (termed gene expression comparison card – see below).
-
Normal expression experiment example:
Visceral white adipose and interscapular brown adipose - adult -
Disease expression experiment example:
Microarray analysis of peripheral blood from influenza and respiratory syncytial virus patients
In disease gene expression experiment cards, the samples are not linked to any other card in LifeMap Discovery, but are linked to cards in MalaCards.
Gene Expression Comparison Card
A comparison card presents two sample groups that were compared and the resulting differential gene expression list. Each sample group is comprised of one or more experimental samples.
-
Normal expression comparison example:
Adult visceral white adipose vs. Adult interscapular brown adipose -
Disease expression comparison example:
Peripheral blood - Influenza infected patients vs. Peripheral blood - healthy controls
In normal expression comparison cards, the samples within each sample group are linked to the same LifeMap Discovery entity card. The differentially expressed gene lists contain the top 100 differentially expressed genes in one sample group in comparison to the other. One of the sample groups can be a reference group not linked to LifeMap Discovery entities. References can be RNA extracted from whole embryo, commercial synthetic RNA or mixed samples.
In disease expression comparison cards, the test sample group is always the diseased tissue, and the control sample group is the matched normal tissue. The differentially expressed genes lists contain up to 200 down- and 200 up-regulated genes in the diseased tissue in comparison to the control.
Large Scale Data Set Card
In addition to data derived from the literature and from high throughput experiments, LifeMap Discovery presents lists of differentially expressed genes derived from large scale data sets:
-
In situ hybridization (ISH) and immunostaining (IS) data sets: these data sets include regional gene
expression information for large numbers of genes in a variety of prenatal and postnatal tissues. A
link to the image from the external database is provided for each gene. Currently, expression data from
the following projects are included:
-
Microarray, expressed sequenced tags (EST) analysis and RNA sequencing data sets: These data sets include
lists of tissue/cell-specific genes for a large number of normal and diseased tissue and cell samples. Currently, expression
data from the following projects are included:
- Homer
- BioGPS
- Tiger
- The gene expression Barcode
- Hematopoietic Fingerprints
- Haematlas
- Cultured cell collection
- Human Protein Atlas - RNA Sequencing Data
- Bodymap 2.0
- Cancer Data from 'The Gene Expression Barcode 3.0' (Disease expression)
- Human Muscle Disease Tissues from Expression Atlas (Disease expression)
Each large scale data set is presented in an experiment card containing a list of its samples.
-
Normal expression large scale dataset example:
Gudmap: Ovary -
Disease expression large scale dataset example:
Cancer Data from 'The Gene Expression Barcode 3.0'
In normal expression datasets, each sample is detailed in its own card, which includes a link to the related LifeMap Discovery card (tissue, anatomical compartment or cell) and the list of genes expressed in the sample. When a sample is linked to compartment or cell card(s), its expressed genes appear in the gene expression list of the linked card(s). When the sample is linked to an organ card, its expressed genes appear in the gene expression list only if the sample is derived from the whole organ/tissue and is linked solely to the organ/tissue card (and not also to a cell or compartment).
In disease expression datasets, the samples are not linked to any card in LifeMap Discovery, but are linked to cards in MalaCards. Each sample card contains a list of up to 200 down- and 200 up-regulated genes in the diseased tissue in comparison to the control.
Gene Expression in Tissues, Anatomical Compartments and Cells
The database presents gene expression information for in vivo and in vitro cell entities:
Organ/Tissues: The organ/tissue cards, which provide a low-resolution description of mammalian development, indicate the total number of genes described in the card itself and in all its related cards, which include developmental path, anatomical compartment, in vivo and in vitro cell, and large scale dataset sample cards. Users can request the full list of genes, which contains annotations for developmental path-specific and developmental path-enriched genes.
Below is a partial sample of the spinal cord gene expression data (the complete summary includes 64 entities and 2,901 genes – 17 developmental path-specific and 5 developmental path-enriched).
Sample from spinal cord gene expression data
The complete summary includes 64 entities and 2,901 genes (17 specific and 5 enriched)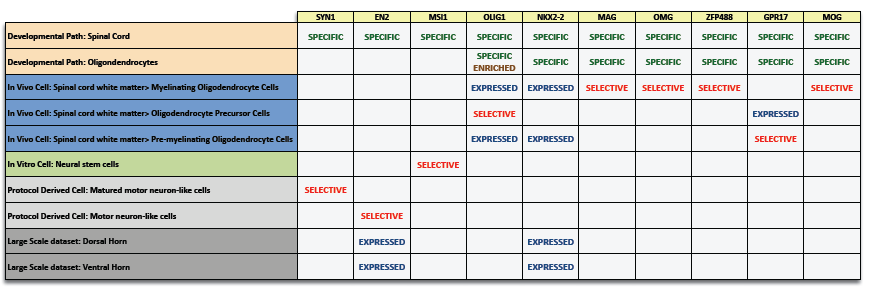 Click to see example: Spinal cord gene expression
Each column in the file represents one gene that is expressed in the spinal cord or its related entities. Gene orthologs are referred to by the same gene symbol.
Each row represents a development path, anatomical compartment, cell or large scale dataset sample related to the spinal cord.
The list contains the following gene types:
- Developmental path-specific genes: Genes that only appear in a specific or few developmental paths.
- Developmental path-enriched genes: Genes that appear in many entities of the same developmental paths (note, they may also appear in other paths).
- Selective genes: Genes that are either established cell markers, or that have been suggested to be characteristic of the cell. Appear only in cell cards.
- Expressed genes: Genes that are known to be expressed in the cells but are not defined as selective cell markers.
In addition, the organ/tissue card includes a detailed gene expression table summarizing genes that have been found, by high throughput gene expression comparisons and/or in large scale data sets, to be expressed in samples taken from the whole tissue.
- Click on Examples to navigate
Anatomical compartments: Gene expression profiles in the anatomical compartment cards, which outline the developmental ancestry of specific temporospatial regions within an organ/tissue, are extracted from high throughput gene expression comparisons and/or large scale data sets related to the specific anatomical region. At the anatomical compartment level, genes expressed in any of the cells that comprise the related compartment are aggregated and presented.
- Click on Examples to navigate
In vivo cells and cultured stem, progenitor and primary cells: Gene expression profiles in the cell card, which details developmental paths taken by cells directed toward specific lineages, include genes expression data collected via manual curation, high throughput gene expression comparisons and/or large scale data sets related to the specific cell.
- Click on Examples to navigate
Gene Annotations
The following information is provided for each gene in each card:
-
The species in which the gene was found to be expressed
- Mouse
- Human
- Chicken
- Rat

-
High throughput/ISH annotation:
- Gene derived from high throughput gene expression comparisons. A link to the comparison card is provided.
- Genes derived from large scale ISH/IS datasets. A link to the relevant image is provided.
-
Manually curated gene annotations (available only at the cellular level):
-
Positive Selective cell marker. Genes that are either established cell markers, or that have been suggested to be characteristic of the cell.
-
Negative selective cell marker. Genes that are selectively not expressed in the cell and have been suggested to be characteristic of the cell, through absence of their expression. Usually, 'selectively not expressed' genes discriminate between developmentally similar cells.
-
Expressed genes. Genes that are known to be expressed in the cells but are not defined as selective cell markers.
-